
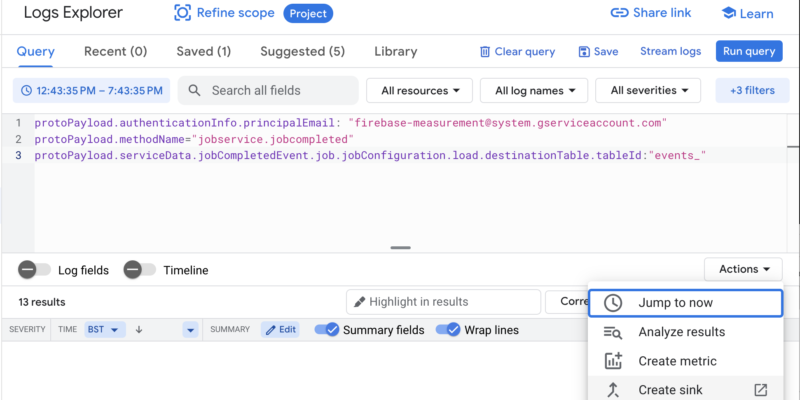
Christopher Bridges “Do not confuse things that are hard with things that are valuable.” ~ James Clear It’s a common fallacy that monitoring data pipelines, and other key performance data, is complicated or costly. Most of the time, it’s usually just not a priority… until something happens to make it vital. The problem is that […]
Blog

Data Enrichment and Data Activation using HubSpot and Server GTM
[Edit: I asked a colleague for some feedback about this post and he shared with me the way that he likes to look at these sorts of issues. Thank you, Mr. You Know Who You Are If You’re Reading This, I’m quoting you below, even though I’m not normally too much of a “McKinsey Guy”]. […]
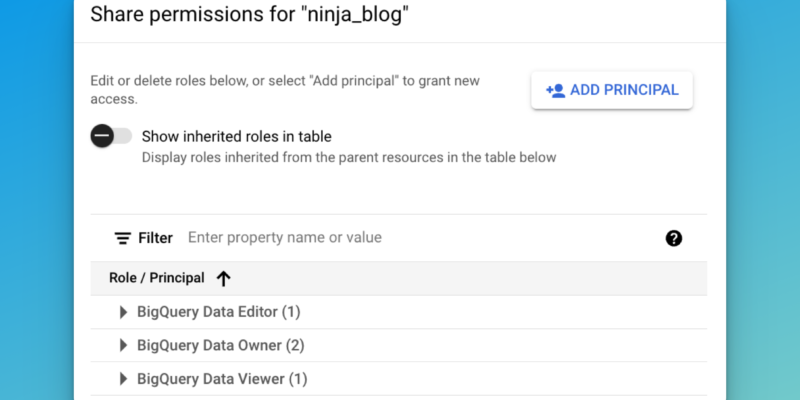
BigQuery – What permissions do I need?
Getting the right permissions in Google Cloud can be complicated and BigQuery is no exception to this. We’re unpacking how to get IAM right and what to do to improve your processes.
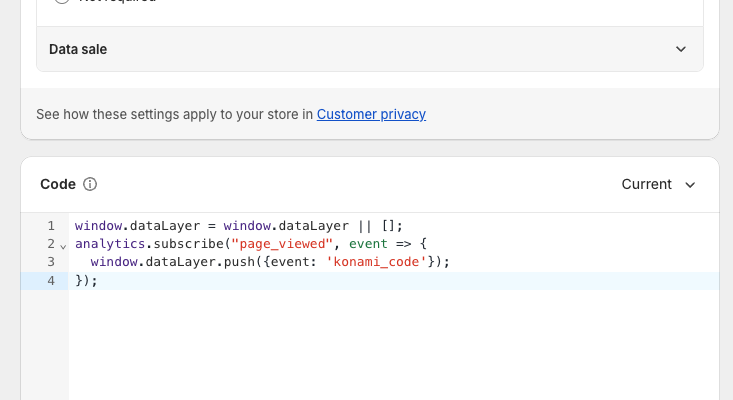
Prevent Shopify App and Custom Pixels from firing without consent
As we worked on updating our consent management logic to align with Shopify’s recent checkout extensibility release for one of our main client (read our previous article on the topic if you are not familiar with it and want to understand this article!) we found out that : Customer events (App and Pixels) are fired even […]
Shopify Checkout Extensibility Review: 8 Months In and Dozens of Implementations
In 2024, anyone working in analytics for Shopify websites has been busy “upgrading” to Checkout Extensibility. This is especially true for Analytics Ninja as one of our major clients is a significant Shopify user with over 30+ websites. The migration, which began in 2023, remains a work in progress, with a few sites still in […]
Reducing BigQuery Costs – Clustering the GA4 events table
Anyone who works with Google Analytics should be using BigQuery for their analysis and reporting. There, I said it. Hit level, raw event data is your best source for whatever you want to report, if you want any accuracy at all. Want to exclude employee traffic? Easy. Found some bots? They’re gone. But this isn’t […]