Christopher Bridges
“Do not confuse things that are hard with things that are valuable.” ~ James Clear
It’s a common fallacy that monitoring data pipelines, and other key performance data, is complicated or costly. Most of the time, it’s usually just not a priority… until something happens to make it vital.
The problem is that by the time you realize you need it, the damage has already been done. Important data pipelines don’t fail gently. They fail loudly, at scale, and usually at the worst possible moment. The result is long downtimes, missing or corrupted data, and a sudden search for accountability instead of answers.
Good News: This is Preventable
Creating a system to monitor and alert on problems with data pipelines or KPIs can be done simply with the advent of Looker Studio Pro connected to a monitoring data source.
Looker Studio Pro is the best kept secret for the most inexpensive and reliable alerting server
Two guiding principles in making a streamlined monitoring and alerting system:
- Simple sophistication – the “less is more” philosophy [Leonardo DaVinci, Steve Jobs]
- Move fast and break things – keep moving and fix things later [Mark Zuckerberg]
Three Alerting Paradigms
Monitoring and alerting systems for data pipeline issues, and for any KPIs, involve three functionality must-haves:
- Right timing: Detected as quickly as the situation requires. Distributed per agreed timing.
- Right reasons: Detected for the conditions that match key business needs
- Right people: The people who need to act on the alert are notified, at the right time.
Rapid Development Building Blocks
- Source data (GA4, Amplitude, Google Sheet, many)
- BigQuery (assumption is that you can query BQ for the Source Data)
- SQL
- Dataform
- Looker Studio Pro
If parts 1 and 2 (above) already exist, the system could be completed in 1-2 days.
The Monitoring and Alerting System
Alerting building blocks using Looker Studio Pro

Outline the Need
Describe the need in a hybrid data user story:
Responsible parties need to know when a severe issue happens, because of this scenario, and be sent/notified this information at this timing, so that these corrective steps are executed by these issue owners.
Example :
Our data engineers need to know when the data pipeline fails specifically for our daily SFTP file upload, because of either of these two scenarios: 1. missing files, 2. wonky data, and be sent/notified when this happens, each day from the time the first incident is discovered until it no longer occurs, every day at 8am, and receive a report that shows the problem data with data range of 7 days prior, with cause, so that our data engineering support team can contact the vendor for our files to fix the issues, reload fixed/new files, and keep the files available to our ML systems.
Pick One or Two Measures and Thresholds
In order to fly fast, we’re picking one measure, and the thresholds by which it’ll be measured to determine an alert condition.
- Measure: metric / KPI to be used to trigger conditions for alerting (e.g. registrations)
- Threshold: limits for the measure (e.g.100)
- Condition: a comparison between the measure and the threshold (e.g. if registrations < 100 then “Low Registration Alert”)
Alerting Conditions and Grades
In the example below there are alert conditions created that are based upon the availability of registration files, which are critical to our client’s business data pipeline.
- We want to know the count of registrations in each day’s file so that we can determine whether the file is ok, or is missing too many records.
- We also want to know when files are missing, so we’ll have to do a check on file dates before and after for that measure.
Next we create Grades that will be stored in a field called interpretation:
- Missing
- Flagged (very low)
- Low
- Normal
- High
In-keeping the idea of moving fast, we’ll apply these definitions below as fungible and adjustable: we can change as-needed to fine-tune the resulting alerts:
- Frequency: 8am every day, the SQL is executed, the dashboard is updated, and the alerts are sent
- Range: Looking at one day of data using yesterday’s date
- Thresholds: We’ll use a 90 day rolling average, compared against yesterday’s data to generate the conditions below
- Grades: Names assigned to given conditions — Missing, FLAG, Low, Normal, High
- Condition: Per above (comparing a measure compare to a threshold)
- Metric: Total Registrations is our key measure
Alert Conditions and Grades for Total Registrations
| Grades | Missing | FLAG | Low | Normal | High |
| Conditions | No file | < 10% | < 80% | <= 120% | > 120% |
SQL Conditions and Full Monitor Script
Below are some examples of BigQuery SQL used to generate the alerting dataset
Conditions and Grades are shown in the field, “Interpretation”
CASE
WHEN is_missing THEN 'MISSING'
WHEN (records / avg_90d) * 100 < 10 THEN 'FLAG < 10% of Avg'
WHEN (records / avg_90d) * 100 < 80 THEN 'LOW'
WHEN (records / avg_90d) * 100 <= 120 THEN 'NORMAL'
ELSE 'HIGH'
END AS interpretation
Full BigQuery SQL Alert/Monitor Script Example
config {
 type: "table",
 dependencies: ["all_registrations"],
 tags: ["alerting"],
 bigquery: {
   partitionBy: "date_of_file"
 },
}

--  1) Generate calendar of all possible date_of_files in the range
WITH calendar AS (
 SELECT day AS date_of_file
 FROM UNNEST(GENERATE_DATE_ARRAY(DATE_SUB(CURRENT_DATE(), INTERVAL 180 DAY),
   CURRENT_DATE())) AS day
),

-- 2) Actual record counts from source table
daily_counts AS (
 SELECT
   date AS registration_date,
   date_of_file,
   COUNT(*) AS records
 FROM `bigquery_database.dataform.all_registrations`
 WHERE
   date BETWEEN DATE_SUB(CURRENT_DATE(), INTERVAL 180 DAY) AND
      DATE_SUB(CURRENT_DATE(), INTERVAL 2 DAY)
   AND date_of_file IS NOT NULL
 GROUP BY date_of_file, registration_date
),

-- 3) Join calendar with counts to include missing dates
all_dates AS (
 SELECT
   COALESCE(dc.registration_date, cal.date_of_file) AS registration_date,
   cal.date_of_file,
   COALESCE(dc.records, 0) AS records,
   IF(dc.date_of_file IS NULL AND dc.records IS NULL, TRUE, FALSE)
     AS is_missing
 FROM calendar cal
 LEFT JOIN daily_counts dc ON cal.date_of_file = dc.date_of_file
),

-- 4) Use all_dates and window functions for 90-day rolling stats
rolling_window AS (
 SELECT
   registration_date,
   date_of_file,
   records,
   is_missing,
   MAX(records) OVER w90 AS max_90d,
   MIN(records) OVER w90 AS min_90d,
   AVG(records) OVER w90 AS avg_90d,
   COUNTIF(is_missing) OVER w30 AS missing_30d,
   COUNTIF(is_missing) OVER w90 AS missing_90d
 FROM all_dates

-- Named WINDOWs below allow reusable named windows.
 WINDOW
   w30 AS (ORDER BY date_of_file ROWS BETWEEN 29 PRECEDING AND CURRENT ROW),
   w90 AS (ORDER BY date_of_file ROWS BETWEEN 89 PRECEDING AND CURRENT ROW)
)

--Final selection with interpretation and completeness check

SELECT
 registration_date,
 date_of_file,
 records,
 ROUND(max_90d, 2) AS max_90d,
 ROUND(min_90d, 2) AS min_90d,
 ROUND(avg_90d, 2) AS avg_90d,
 missing_30d,
 missing_90d,
 CASE
   WHEN avg_90d = 0 THEN '0%'
   ELSE CONCAT(ROUND((records / avg_90d) * 100, 2), '%')
 END AS compare_90day,
 CASE
   WHEN is_missing THEN 'MISSING'
   WHEN (records / avg_90d) * 100 < 10 THEN 'FLAG < 10% of Avg'
   WHEN (records / avg_90d) * 100 < 80 THEN 'LOW'
   WHEN (records / avg_90d) * 100 <= 120 THEN 'NORMAL'
   ELSE 'HIGH'
 END AS interpretation,

FROM rolling_window

WHERE date_of_file < CURRENT_DATE()
Code highlights:
- In the BQ SQL above, the key output as a result of several CTEs and Window functions are the “interpretation” grades, and their attributed registration_date, date_of_file, and records.
- Along the path we also calculated some convenient measures that make life happier when analyzing file outages or low record counts: max_90d, min_90d, and avg_90d, which are exactly as they are named.
Dataform
Configuration: set as a table, replaced daily, a rolling 180 days.
config {
 type: "table",
 dependencies: ["all_registrations"],
 tags: ["alerting"],
 bigquery: {
   partitionBy: "file_date"
 },
}
Using Dataform – the workflow
- Workflow configuration to run daily at 8am PST.
- Config code in SQLX file: the “tags” config variable is assigned “alerting” as a value so that this can be used in the Workflow as the selected tag to run at 8am PST.
Looker Studio Pro Alerting Dashboard
Below is an example of a completed Looker Studio Pro dashboard for alerting on registrations for the conditions:
- Missing files
- Flagged files (very low volume)
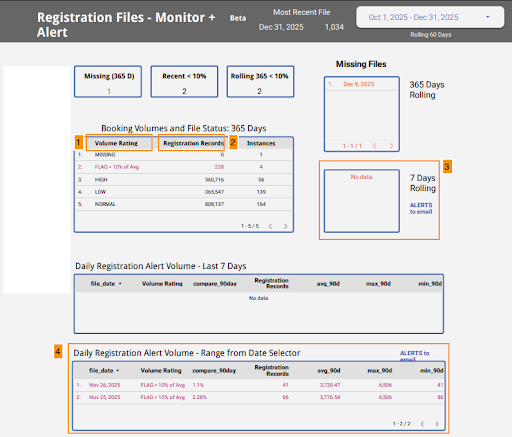
- Volume rating = Interpretation field in the dataset
- Registration records: totals of the registrations metric
- Missing files table: Alerting enabled
- Flagged volumes table: Alerting enabled
Missing Files Table alerting configuration
- The “7 days rolling” table exists for the sole purpose of applying the Looker Studio Pro alerting feature.
- The table is set to show instances over the last 7 days when the dataset field interpretation = “missing”, and the date of the missing file is presented.
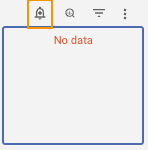
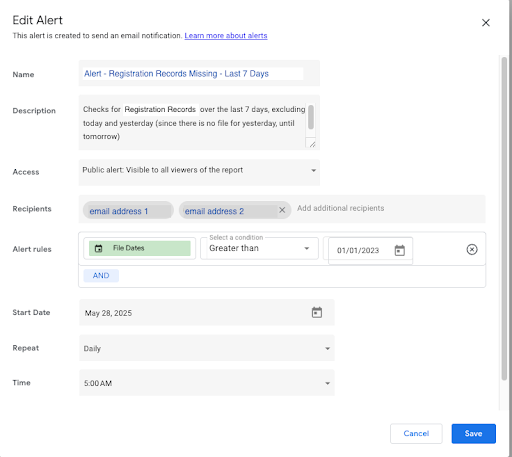
At Last – Configure an Alert!
- Alerts can be configured on any chart or table, using the metrics and dimensions within
- Enter View mode: hover on a chart or graph, click on the 🔔 above it (alerts are only configurable in View mode in Looker Studio Pro)
- Click on the vertical ellipsis:
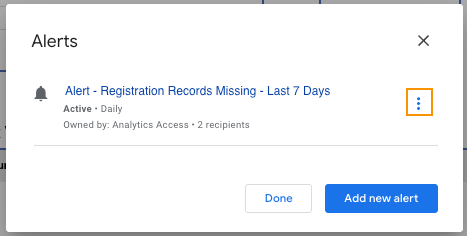
- Click on Edit
Configure the alert:
- Name: this is the field that will become the subject and part of the contents of the email sent by the alert.
- ** Name it something recognizable so that you can use this name to create a distribution, or forwarding to all who should be receiving it. Best is to start it with “ALERT” + something to differentiate it from all other alerts you may send.
- (e.g. “ALERT – Registrations – …”)
- Description: This is the text content that will be sent in the email. Write it so that it’s actionable.
- (e.g. ALERT – Registration – Missing Files – Last 7 Days has reached set condition.)
- Access: Change as desired for security.
- Recipients: Email addresses who can receive it. These addresses can only be those who are members of the organization that owns the license for Looker Studio Premium.
- Distribution of Alert Messages: If you need to send alert messages to people or systems whose email addresses are not part of your organization, then email forwarding will need to be used in order to send alert notifications to other recipients.(e.g. Gmail, Outlook… )
- Slack or other:: Set up an email account to the channel you prefer. Use that as a forwarding address for emails that match a filter such as “contains ‘ALERT – Registration’”. Slack help
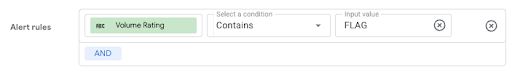
- Alert Rules: These can be any conditions you create using the metrics and dimensions that are part of your dataset, and are present in the graph or table used to control the Alert.
- In the example below:
- Name: this is the field that will become the subject and part of the contents of the email sent by the alert.
Email Alerts and Forwarding
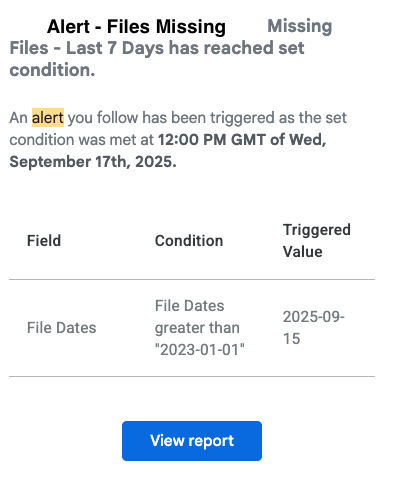
- Message Contents:
- The body of the alert message contains text from the alert description. Alert title becomes the email subject. The rest of the message shows the triggered value and condition that generated the alert, and a button that clicks through to the alert dashboard.
- Filtering and Forwarding:
- To filter / forward these emails to other recipients we can use the email subject and choose something like, Contains “Alert – “.
- Making this work for different types of alerts that may need to be forwarded to different recipients, it’s important to have mindfully titled the alerts while defining them in Looker Studio Pro.
- (e.g. Person A needs to receive alerts on Missing Files, while person B needs to only know when files are Flagged as Low — include those keywords in the names of the individual alerts for each condition, and then filter on them.)
- Sending to Slack (worth doing):

- Any Slack channel can be configured with an email address.
- To send alerts to a channel, configure an email filter to forward to that channel via address.
- Alternatively: select your tool préféré and set up email forwarding to it.
- Texting Alerts:
- I recommend this for critical pipeline and KPI alerts, but to a limited distribution.
- This can be set easily if the mobile service supports a text to email address for accounts which is then used to create an email forwarding filter (above)
- There are also numerous paid texting tools, and extensions for Slack.
* * See this blog post for tips on setup if you have issues.
Et voila!
Summary
Move fast, keep it simple
- Outline your needs and measures
- Make your SQL query, launch it in Dataform to create the table(s)
- Create a Looker Studio Pro dashboard
- Configure your alerts in the dashboard
- Set alerts to be sent according to: right timing, right data, right people
Success looks like
- Not needing alerts, but being glad you’ve had them in place long enough to identify and fix the issues that keep reappearing.
- Success also looks like building on what you have by finding more opportunities to use this type of simple monitoring and alerting solution in other places in your business to improve revenue.
- Revisit your thresholds. You may want to use some ML to figure out the best threshold to use other than a 90 day rolling average.
- Dial up or down the type and frequency of alerts based upon observed need.
Contact us and we can make the first one for you.
Leave a Reply